Start with solids and pore space
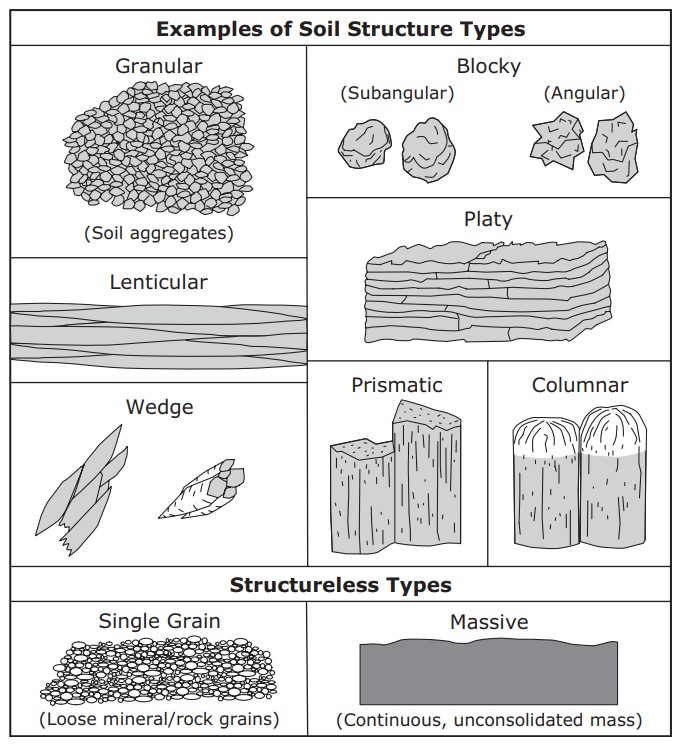
Soil contains mineral particles, organic material, water and air. Their proportions vary with soil type, compaction, wetness and management. The balance between solids, water and air changes with the soil and its moisture condition. Water and air occupy a pore network whose arrangement strongly influences movement and root growth. Texture describes the distribution of mineral particle sizes, while structure describes how particles are arranged into aggregates and pores. These properties complement each other. A soil can have the same texture as another field but behave differently after traffic, cultivation or long-term organic matter changes.
Connect texture with structure
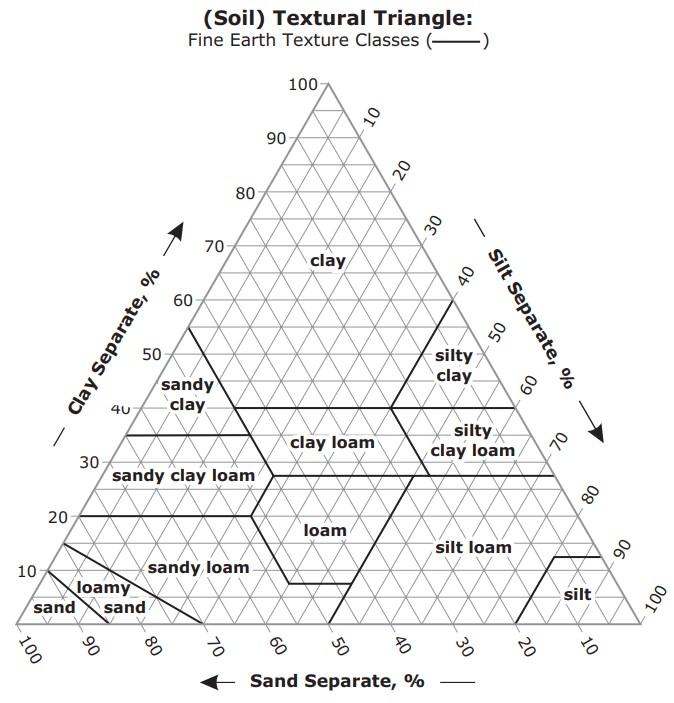
Sand, silt and clay influence surface area, water retention and drainage, but particle size alone does not determine infiltration. Connected large pores can transmit water quickly, while a compacted surface or restrictive layer can slow entry or movement. Cracks can bypass portions of the matrix and create rapid responses at depth. Assess aggregate arrangement, roots and visible pores when inspecting a profile. Our texture guide explains particle-size classes and their limitations. Avoid assigning a universal irrigation duration from a texture name without observing how the actual field accepts and redistributes water.
Bulk density and rooting conditions
Dry bulk density expresses dry soil mass per bulk soil volume, including the pore space. It differs from the density of the mineral particles themselves. Compaction can raise bulk density and alter the balance and connectivity of pores, with consequences that depend on texture and initial condition. Roots may follow cracks or stop at dense layers, affecting which sensor depths represent active uptake. Bulk density also enters the conversion from gravimetric to volumetric water content. Collect representative measurements at the relevant depth when that conversion is needed; a generic value can introduce a substantial error into an otherwise careful sample comparison.
Water content, retention and movement
Water content measures the quantity of water in a given soil volume. Matric potential describes how tightly it is held through capillary and surface interactions. A retention relationship connects these quantities for a particular material. Hydraulic conductivity describes the ability to transmit water and changes as the soil wets or dries. Field capacity and permanent wilting point are useful concepts, but their operational values depend on the soil and measurement conventions. Check local data before calculating available water. Monitoring several depths can reveal wetting and drying patterns without assuming every sensor represents the same storage capacity.
Include the chemical environment
Soil pH influences chemical reactions and nutrient availability. Electrical conductivity responds to conducting pathways and dissolved ions, with its interpretation depending on the measurement method and moisture condition. Organic matter and clay contribute to exchange and buffering properties. These chemical characteristics affect crop performance alongside the physical environment. A field with suitable moisture can still have an unfavourable chemical condition. Use laboratory tests to answer nutrient and amendment questions that a moisture probe cannot resolve. Read soil pH and soil EC before comparing numbers from different extraction methods or instrument types.
Build a field description before installation
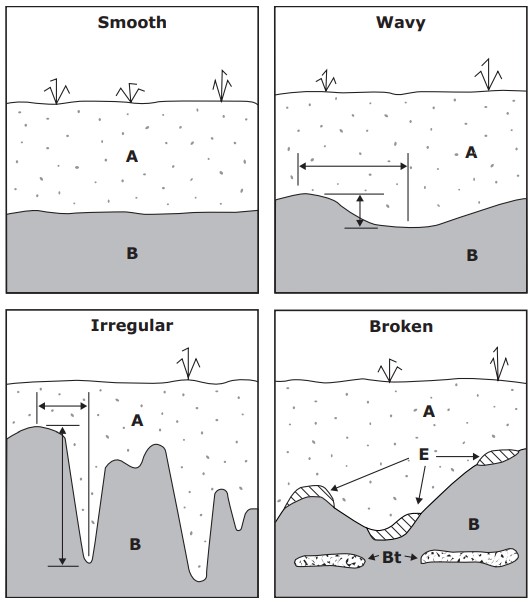
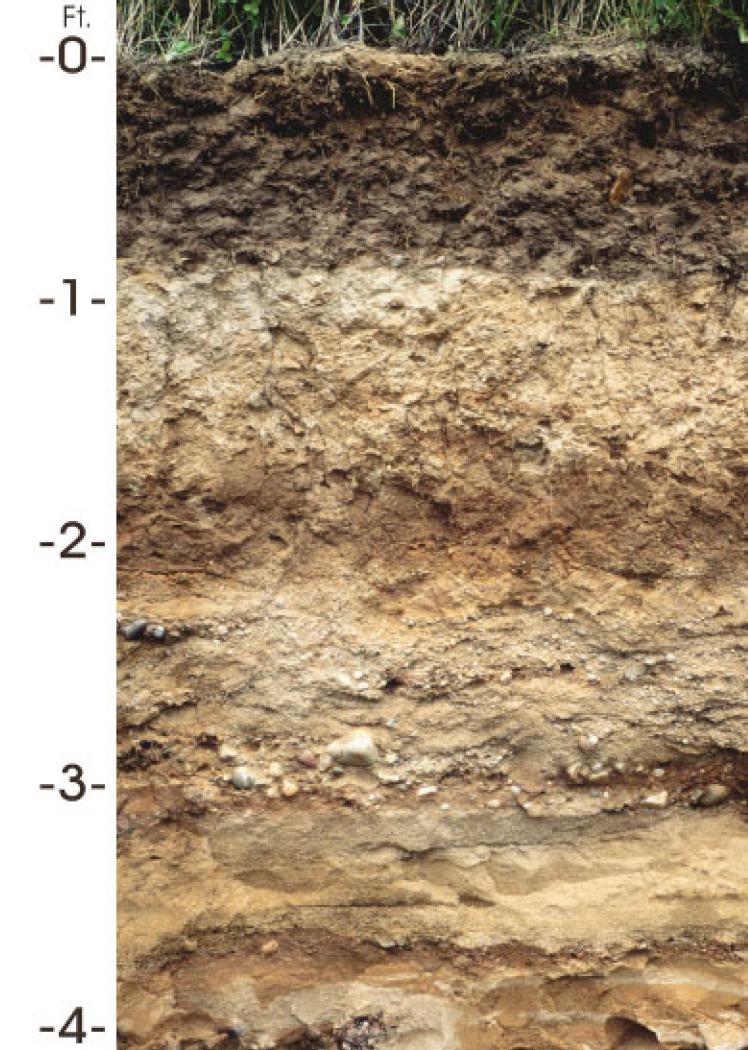
Describe management zones using soil information, crop observations and a practical profile inspection. Record texture changes, horizon depths, stones, rooting and signs of restricted drainage. Different readings at neighbouring points do not identify a perched water table by themselves; installation, irrigation distribution and natural variability are alternative explanations. Place sensors where each will answer a defined question, such as upper-root-zone drying or deeper wetting after irrigation. Keep photographs and notes with the data so future staff can interpret the layout. Our applications guide connects this field description with monitoring decisions for different crops and irrigation systems.
Common questions
Does texture determine the whole irrigation schedule?
No. Structure, rooting, layering, weather and irrigation distribution also matter. Combine a soil description with observed wetting and drying patterns.
What should I record when comparing readings?
Keep the date, sensor model, depth, location, measurement units and calibration with the reading. Record irrigation and sampling methods where relevant so that later comparisons describe the same quantity and field conditions.
Apply this to your monitoring plan
Inspect the soil as a layered, changing system before choosing a monitoring location.