What is soil texture?
Soil texture describes the proportions of sand, silt and clay in the fine-earth mineral fraction. These particle sizes influence pore spaces, water retention and how soil responds to wetting and drying. The texture class is a useful starting description for irrigation planning and sensor interpretation.
In the USDA system, sand particles are 0.05 to 2 mm in diameter, silt is 0.002 to 0.05 mm and clay is smaller than 0.002 mm. Other classification systems can use different boundaries, so retain the method with a laboratory report.
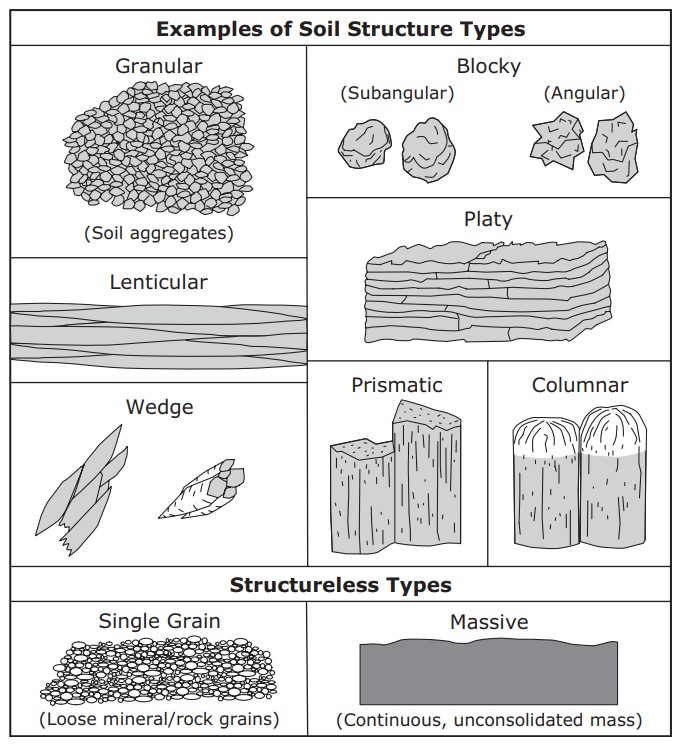
Texture differs from soil structure. Texture describes particle-size proportions; structure describes how particles are arranged into aggregates and pores. Compaction, roots, cracks and cultivation can change water movement without changing the measured sand, silt and clay percentages.
Understand the soil texture classes
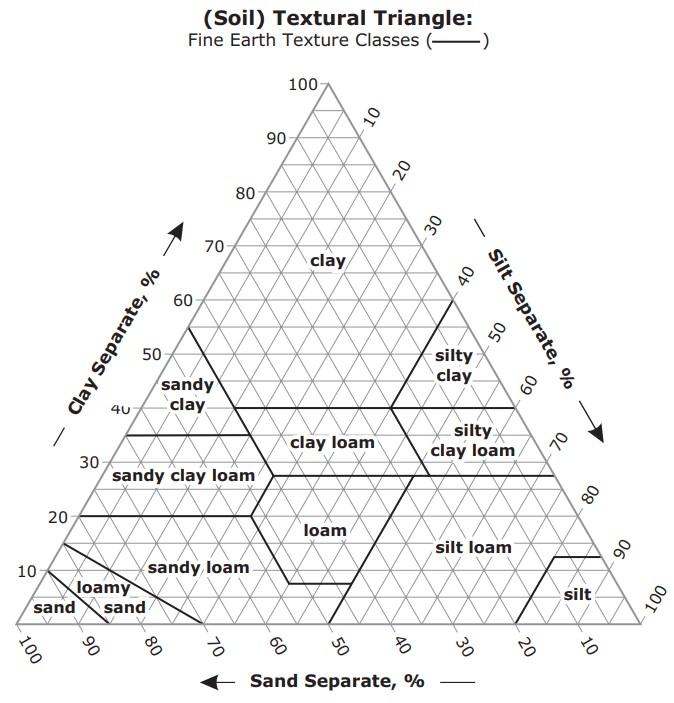
The USDA texture triangle classifies soil using the percentage of each fraction. The three percentages sum to 100%. Loam describes a defined region of that triangle, not a requirement for equal quantities of sand, silt and clay.
The twelve classes are sand, loamy sand, sandy loam, loam, silt loam, silt, sandy clay loam, clay loam, silty clay loam, sandy clay, silty clay and clay. A result such as sandy clay loam contains more information than describing a field simply as heavy or light soil.
Laboratory particle-size analysis provides a measured classification. Texture by feel offers a field estimate: sand tends to feel gritty, silt smooth and clay sticky or plastic when sufficiently moist. The technique needs practice and is less precise than a measured analysis. Use the USDA soil texture calculator to classify known percentages.
How texture affects water storage and drainage
| Soil tendency | Water behaviour | Monitoring question |
|---|---|---|
| Sand-rich | Often drains quickly and stores relatively little water between irrigations. | How quickly does the active root zone dry, and does water pass below it? |
| Loamy or silt-rich | Can hold substantial plant-available water, depending on structure and profile. | How does storage change at the monitored depths after each application? |
| Clay-rich | Often retains more total water, but a portion is held strongly; matrix flow may be slow. | Do drainage restrictions, cracks or compaction alter the expected wetting pattern? |
These tendencies do not establish irrigation thresholds. Total retained water and plant-available water are different quantities. Rooting depth and the difference between field capacity and wilting point help describe the water the crop can use.
A clay-rich soil is therefore not automatically the soil with the greatest usable water storage. Pore arrangement, organic matter and layers beneath the surface can materially change the result. Confirm the behaviour with field observations and suitable soil measurements.
Look below the surface
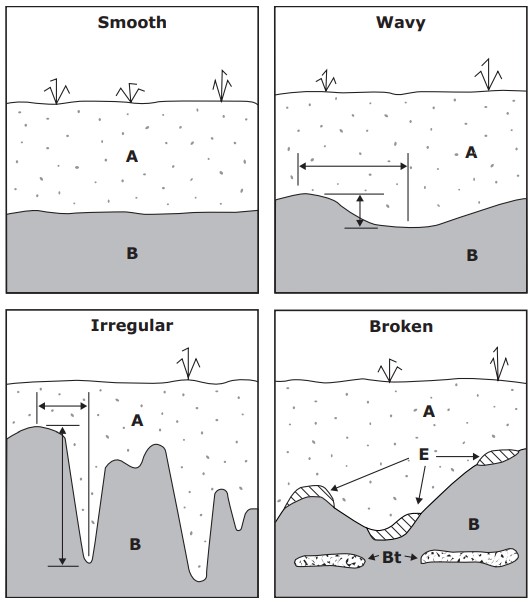
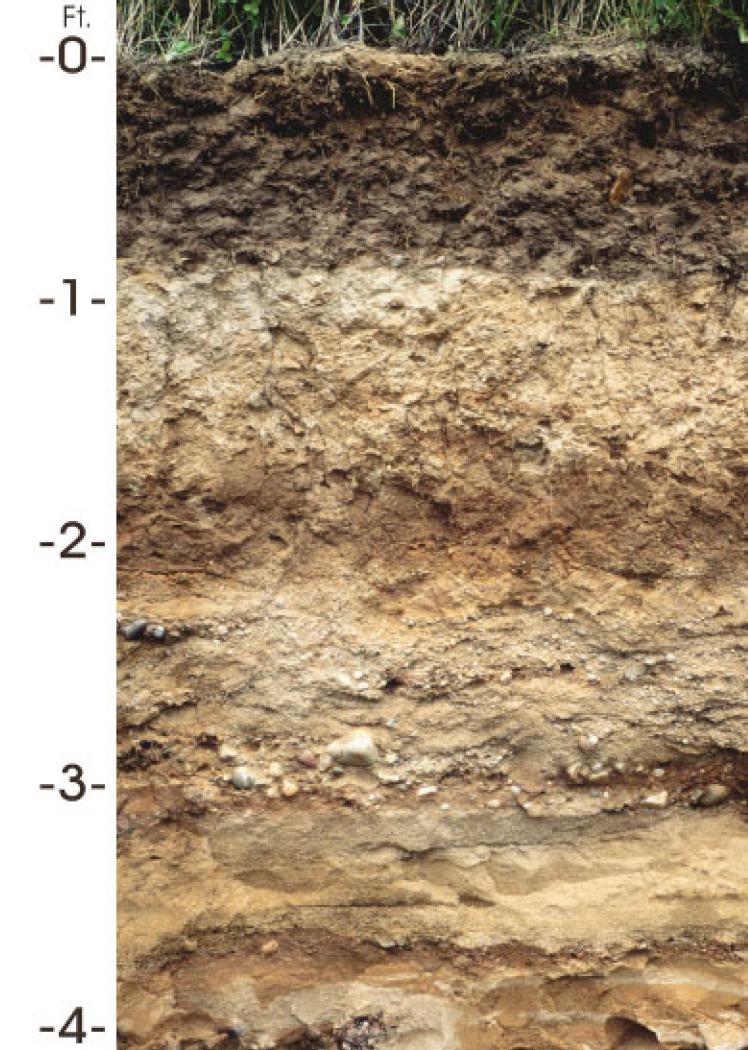
A farm's surface texture may differ from the subsoil. A sandy layer over a finer layer, a compacted horizon or shallow bedrock can alter wetting, drainage and root development. Describing only the top few centimetres misses conditions that a deeper probe will measure.
Record texture changes alongside depth, visible roots, compaction and any evidence of poor drainage. Use those observations to choose sensor depths that represent the active root zone and relevant boundaries. A profile probe with several sensing levels can show that one layer wets or dries differently from its neighbours.
For crop management, group areas by their soil profile, irrigation system and crop conditions. If a block contains substantially different soils, one monitoring point may not represent both. Avoid averaging readings from unlike soils without a clear interpretation of what that average means.
Use texture to plan a monitoring network
- Review available soil maps and check representative profiles in the field.
- Identify changes in texture and rooting conditions with depth.
- Separate areas with different irrigation delivery or drainage behaviour.
- Place sensors where the readings represent an actual management zone.
- Check how each zone responds to irrigation and dries between events.
Texture can also affect the relationship between a dielectric sensor signal and water content. Use the calibration guide to decide whether the factory relationship is adequate for a particular layer or growing material.
For different monitoring layouts, read about the TEROS 10 point sensor and the Sentek Drill & Drop profile probe. Choose the sensing arrangement around your field questions, then compare communication and power separately.
Common questions about soil texture
Can I use a texture class to set an exact moisture trigger?
A class can guide the initial investigation, but measured water retention, rooting conditions and crop demand are needed to refine a trigger. Follow the irrigation guide to connect readings with field capacity and allowable depletion.
Does adding organic matter change clay into loam?
Organic matter can affect structure, water retention and soil management. It does not directly replace the mineral particle-size proportions used to define a texture class. Measure those proportions if a precise classification is needed.
Apply this to your monitoring plan
Connect the texture class with a practical field assessment and the wider soil profile.