Measure an electrical response by frequency
Frequency domain soil moisture instruments interrogate an electrical response related to the dielectric properties of the surrounding soil. Depending on design, the measured quantity may involve resonant frequency, oscillator behaviour, impedance or a response at one or more operating frequencies. Manufacturers sometimes use FDR broadly for frequency-based dielectric methods. The abbreviation alone does not identify a single circuit arrangement. Water content is estimated by converting the measured response through a calibration. Ask which quantity the device measures and what processing produces the final moisture value. That explanation is more useful than assuming every frequency domain product operates in exactly the same way.
How capacitance connects to the measurement
Electrodes and the material within their electric field behave as part of a capacitive system. Replacing some air in the pore space with water generally changes the response substantially. In an oscillator or resonant circuit, that change can alter the measured frequency. Other instruments analyse impedance or use several frequencies to characterise the material. A reflected wave does not necessarily acquire a new frequency simply because it encounters a boundary; the circuitry and measurement strategy matter. Our capacitance guide distinguishes frequency measurements from charge-time methods and explains why electrode contact remains important.
Recognise the sampled volume
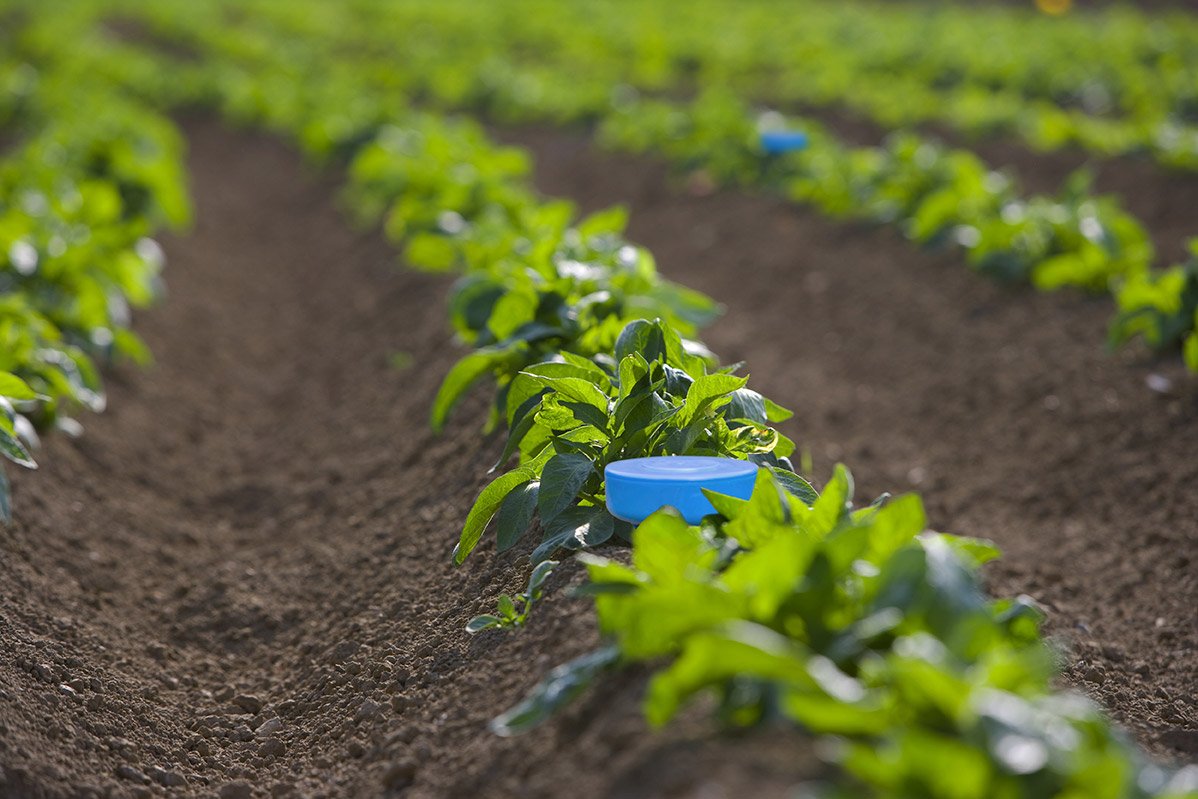
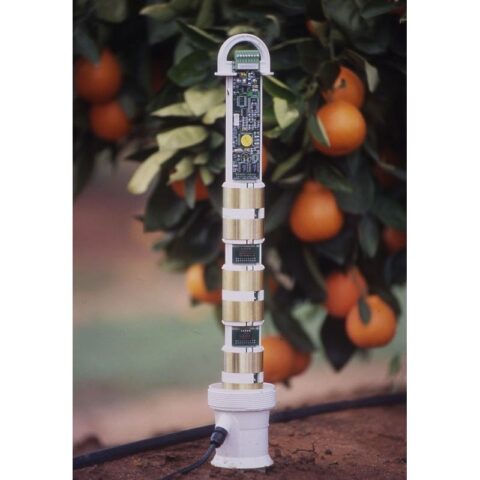
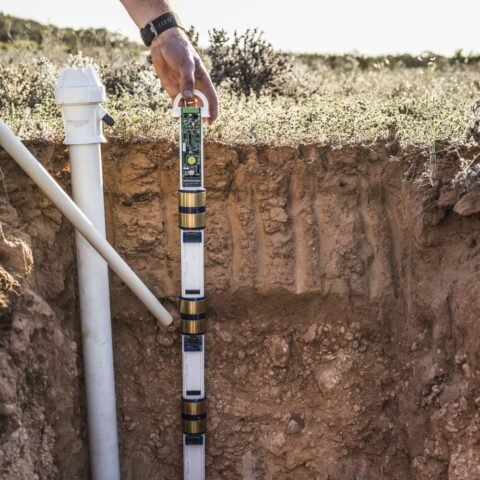
The sensor responds to the soil reached by its electric field, with sensitivity typically varying across that volume. Probe geometry, installation and nearby materials influence the reading. A single-point sensor may represent one depth, while a profile system includes multiple sensing positions. An access-tube design must maintain the intended relationship between the sensor, tube wall and surrounding soil. A void beside the tube can bias several measurements at once. Review installation guidance before deciding that a profile automatically represents the whole root zone. Our soil profile guide helps connect measurement depths with real layer boundaries.
Check conductivity and temperature effects
Soil conducts current as well as storing electrical energy. Conductivity and dielectric losses can affect frequency domain responses, with their influence depending on frequency and circuit design. Clay mineralogy, density and temperature may also alter the water-content conversion. A device operating at a higher frequency is not automatically immune to all these effects. Compare the documented soil conductivity range, correction approach and calibration conditions for each product. If the manufacturer publishes separate limits for measurement and communication, keep them distinct. A stable radio connection does not establish that the moisture conversion remains valid in a saline soil.
Validate the installed sensor
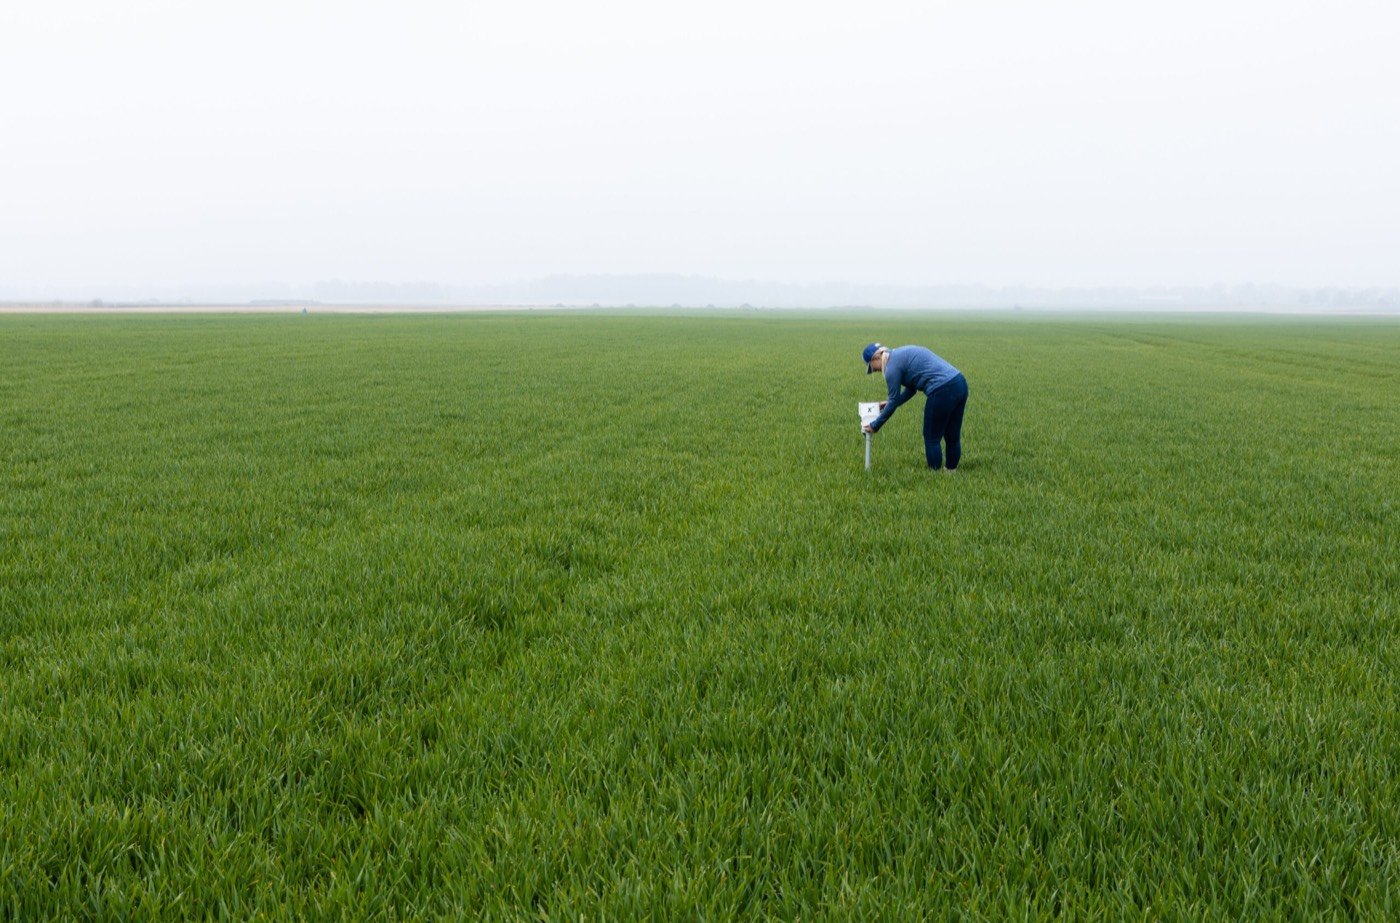
Start with the calibration specified for the soil or substrate and preserve the raw response if the system provides it. Check readings during wetting and subsequent drying at each depth. Differences between layers can be real, so compare independent samples with the same local material rather than averaging the complete profile immediately. A soil-specific calibration should cover the operational moisture range and include a check using observations outside the fitted dataset. The calibration guide describes gravimetric and volumetric comparisons. Revisit installation contact when a sensor changes abruptly after cultivation, movement or access-tube disturbance.
Compare FDR with TDR fairly
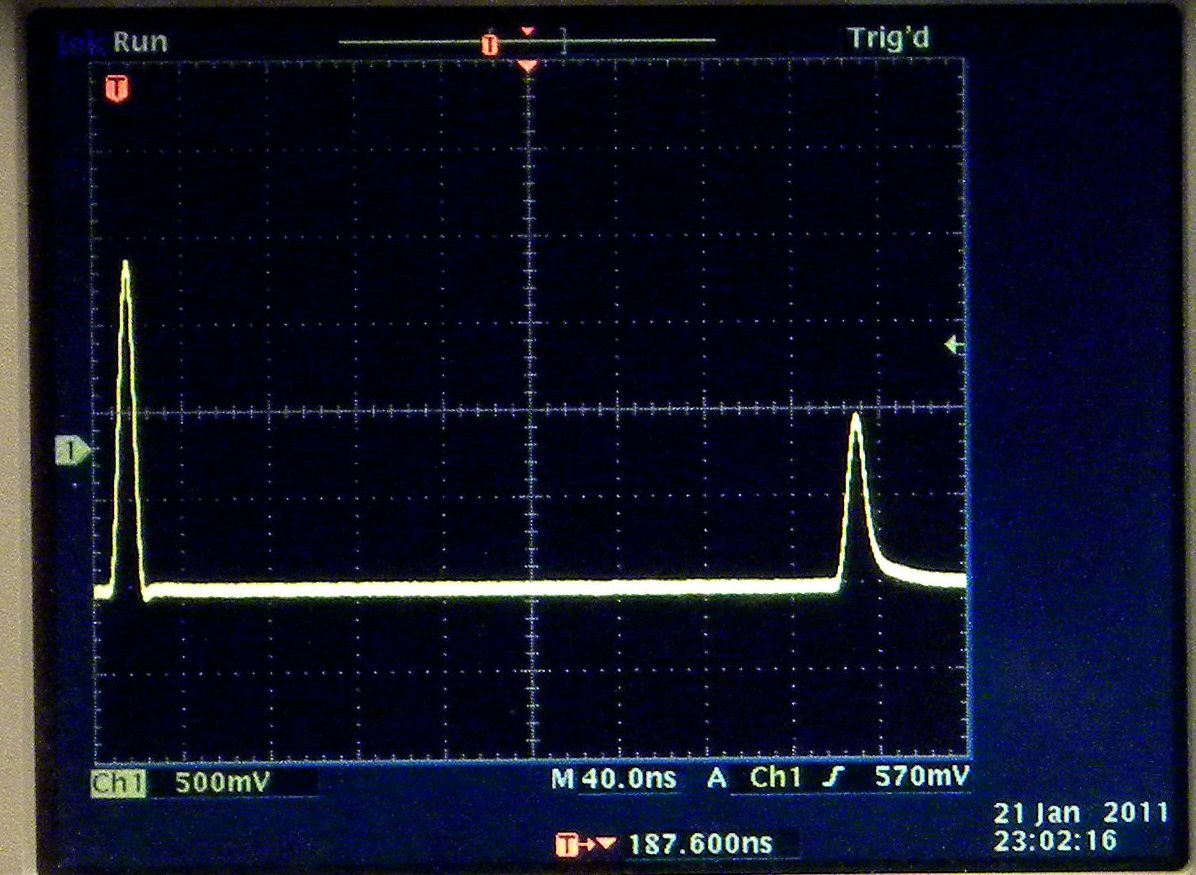
Both frequency domain and time domain techniques can estimate water content from dielectric behaviour. TDR uses signal travel and reflection timing; frequency domain instruments use their particular frequency-related response. Neither family has one universal accuracy or price. Compare performance with the calibration, soil range and installation conditions stated explicitly. Then examine the complete field system: measurement depths, logging interval, power supply, data delivery and maintenance. A profile that reveals water movement can help an irrigator understand penetration, but useful interpretation still requires representative placement. Use the comparison page to assess complete installations alongside the measurement method.
Common questions
Are all FDR sensors equivalent?
No. Circuit design, operating frequency, geometry and calibration differ. Compare the actual model and installation under relevant conditions.
What should I record when comparing readings?
Keep the date, sensor model, depth, location, measurement units and calibration with the reading. Record irrigation and sampling methods where relevant so that later comparisons describe the same quantity and field conditions.
Apply this to your monitoring plan
Compare both the measurement principle and the equipment needed to obtain usable readings.