Identify what the graph actually displays
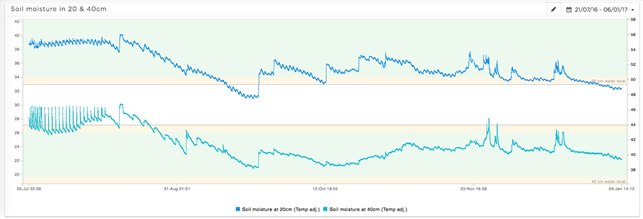
Check whether the vertical axis shows volumetric water content, tension, a raw sensor value or another index. Confirm units, depth labels, timestamps and the interval between observations. A daily average and a short-interval record can show different event shapes. A combined profile value may conceal opposing changes in separate layers. Keep the uncombined depth records available when interpreting irrigation.
Place irrigation, rainfall and maintenance events beside the record. Note whether a firmware, calibration or location change occurred. A graph is more useful when its observations can be connected to field events rather than interpreted from shape alone.
Look at the wetting response by depth
An increase after irrigation indicates a change in the material represented by that sensing region. Upper layers may respond before deeper layers, but timing depends on infiltration, preferential flow, emitter position and the profile. A rapid deep response can occur through cracks or channels while other portions remain relatively dry. It does not prove uniform replenishment between the sensors.
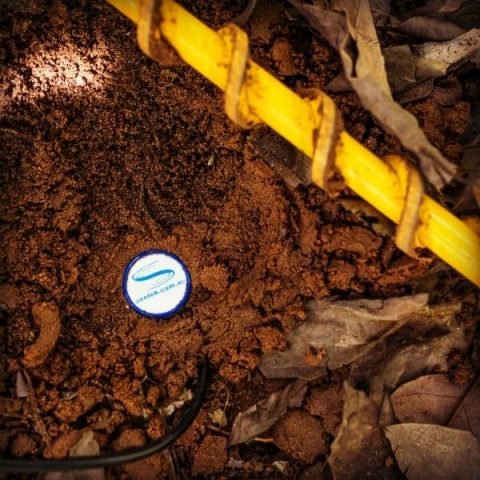
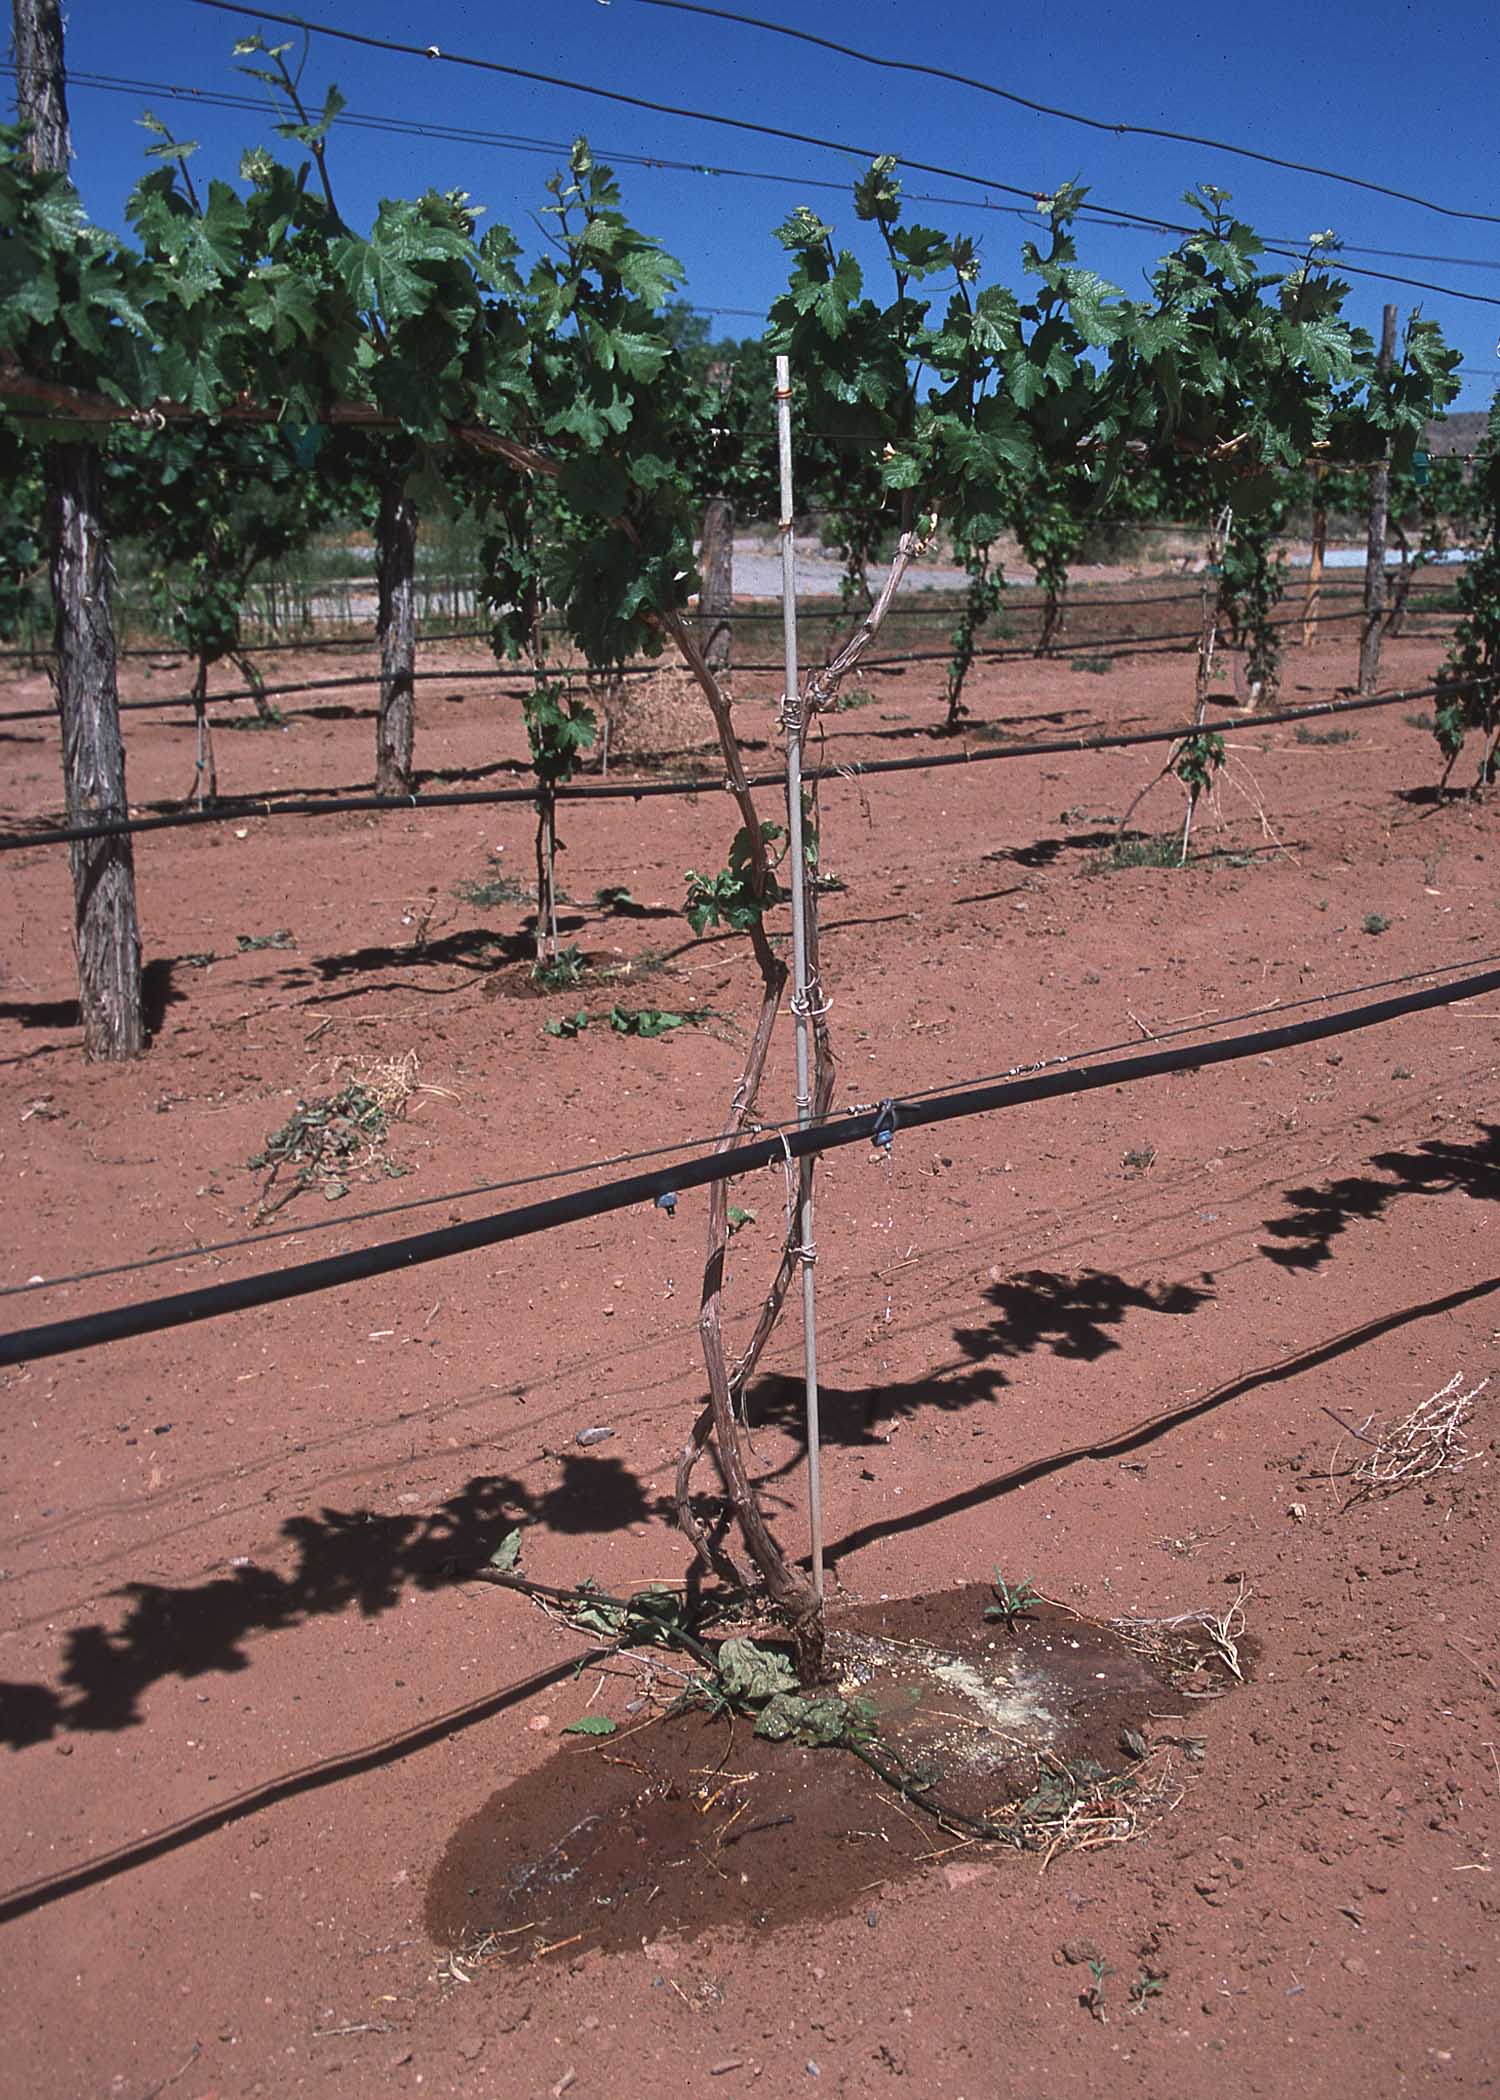
Compare the response with the placement record. If the selected depth remains unchanged, investigate application amount, distribution and the local sensing volume before assuming a sensor failure. Soil layers can delay or redirect movement and explain different responses along one profile.
Interpret drying with crop and weather context
A declining moisture trend can reflect root uptake, evaporation, drainage or combinations of these processes. The relative importance changes with depth and wetness. A faster decline immediately after wetting may include drainage; subsequent changes can be dominated by uptake or surface loss. Daily patterns can be informative, but temperature sensitivity and sampling time should also be considered.
Compare periods with similar irrigation and crop conditions before concluding that the crop’s demand has changed. A reduction in the drying rate can have several explanations, including weather, growth stage or a drier soil restricting uptake. Pair the record with field observations and, where appropriate, water tension.
Use established thresholds and storage calculations
Locate locally validated refill or management thresholds on the relevant depth records. Crossing a line should trigger review of the crop and system, not an automatic assumption that every part of the field has reached the same state. When estimating stored water, use volumetric values and the layer thickness represented by each measurement. A sensor at one depth is not automatically the average for an arbitrary whole-profile thickness.
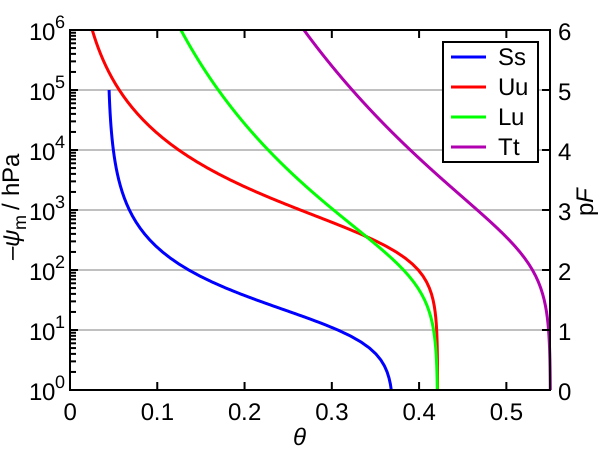
Our field-capacity guide describes local reference values, and the scheduling guide provides water-depth arithmetic. Changes in tension cannot be inserted directly into the volumetric storage equation. Keep those quantities separate even when both curves appear on the same dashboard.
Recognise changes that need a check
An abrupt step without a field event can follow disturbance, a changed calibration, a reset or a data-processing issue. A flat line can mean stable conditions, a failed channel or repeated stale values. A gap means observations or uploads are missing; it should not be filled mentally with a smooth drying trend. Inspect the timestamps and raw record before changing an irrigation schedule.
Use troubleshooting to separate measurement and delivery faults. Check another depth, a nearby representative location or an independent sample where it answers the question. Preserve the original record and document the explanation, especially before applying offsets or excluding values. This creates a more reliable seasonal history.
Common questions
Does a deep response mean I have irrigated every root?
No. Preferential paths and uneven wetting can create a local response without uniform replenishment.
Can a flat graph be normal?
Yes, but check fresh timestamps and other evidence. Stable soil conditions and stale repeated data can look similar.