Define the record before connecting applications
A useful soil record includes the site, device, sensing depth, timestamp, units and the variable measured. Record the time zone and whether a timestamp represents measurement or upload. These details become especially important when a device stores observations through an outage and sends them later: several newly received records may describe earlier conditions rather than an immediate change in the soil.
Keep moisture content, water tension, temperature and EC in clearly labelled fields. An EC value without its measurement definition can be misused when compared with a laboratory result. A moisture percentage without calibration context can be misinterpreted as available water. Document replacements and depth changes so a series from a new sensor is not silently treated as a continuation of the same measurement setup.
Create alerts around actions and data quality
Choose an irrigation alert from a verified local operating range, then define who reviews it and what they check. A trigger at one depth should be interpreted with other depths, recent irrigation and crop conditions. Use a suitable duration or persistence rule to avoid repeatedly escalating an isolated spike, and allow for the system’s actual reporting interval.
Missing data require an alert distinct from a dry-soil alert. A stale reading should not be shown as a current value without a visible age. Repeated high readings also deserve a defined investigation path because they may indicate drainage, irrigation or sensor placement issues. The troubleshooting guide separates measurement faults from data delivery problems.
Verify export and interface capabilities
If you need a spreadsheet, external dashboard or application interface, ask for documentation of the supported export or API, its data fields, authentication, limits and service terms. Do not assume that every platform exposes all raw values or retains data indefinitely. Test a representative sample before making a workflow dependent on it, including timestamps and the behaviour of missing observations.
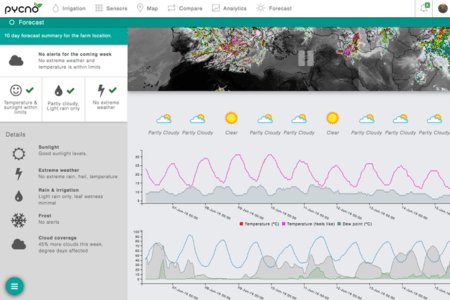
The comparison pages describe system arrangements, but a product’s connected dashboard does not by itself prove a particular CSV export, public API or controller integration. For Pycno or another supplier, verify the specific capability and service package you intend to use. The useful advantage of an integrated platform is reduced assembly and a clearer support path where the documented features meet the job.
Distinguish monitoring from automatic irrigation
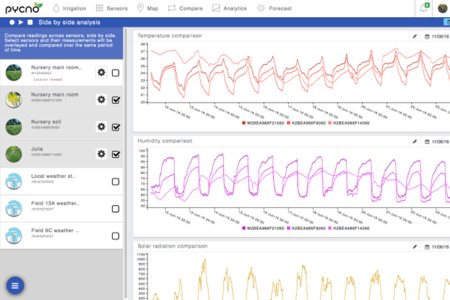
A remote view or notification supports a human decision. Automatic irrigation requires a documented path from measurement through decision logic to the controller, with behaviour defined for missing data and communication outages. Check which component makes the decision and whether it can operate when the internet connection is unavailable. Do not treat an attractive dashboard as evidence of a complete control system.
Begin with an observable workflow: review the trace, inspect a questionable condition, adjust an event and verify the outcome. Keep irrigation and weather records with the soil data. Read moisture graphs and system architecture before extending the setup. A successful integration preserves the meaning and freshness of the measurements while making a specific field action easier to carry out.